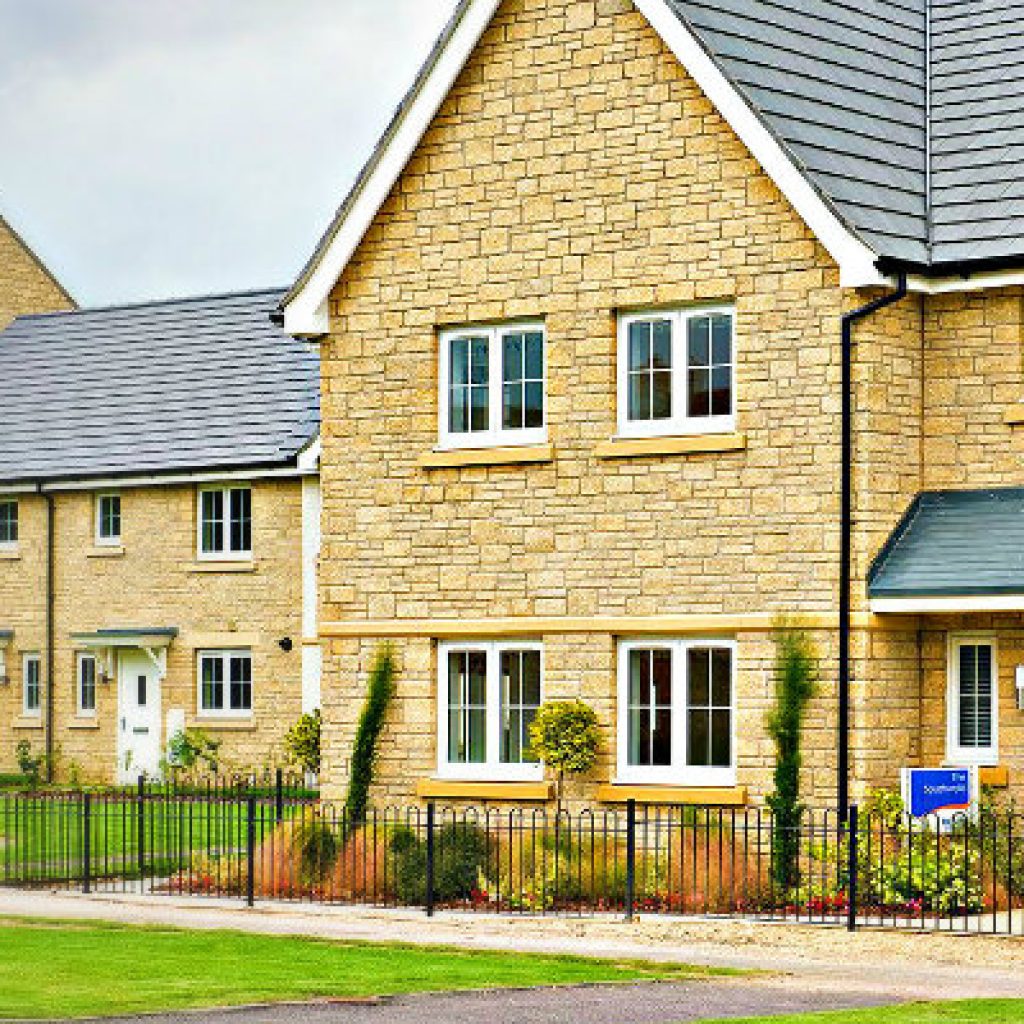

The Housing Price Index for July has recently been published.
Replacing the separately published house price indices from HM Land Registry and Office for National Statistics, the UK Housing Price Index provides a detailed summary of the recent house price statistics.
Introduced in 2016, the UK HPI comprises of all residential properties bought for market value within the UK. However, there may be a delay before transactions sync into the index as sales will only show up in the HPI after they have been registered. It is, therefore, important to bear this in mind when looking at the most recent periods of price changes – these may be amended.
In the year to July 2017, UK house prices on average have seen a rise of 5.1%, with a month on month increase of 1.1%.
At a regional level, the most significant rise in annual average property price occurred in the East Midlands, with a growth of 7.5%.
On a monthly basis, the greatest increase was witnessed in the North East, with average property prices growing by 3.3%.
At the other end of the spectrum was London, where annual prices rose by just 2.8%.
Month-on-month, the South East experienced a fall in terms of average prices, dropping by 0.4%.
Commenting on the rise in prices was Owen Woodley. The Managing Director of Post Office Money stated:
“It’s good to see the market has remained steady despite a somewhat uncertain political and economic climate and on the whole, we anticipate continued slow but steady growth through the remainder of the year. While recent Post Office Money research shows that 62% of home sales are in areas that are affordable for first-time buyers*, the reality for many is that they continue to face an uphill battle to get their foot on the ladder especially those in the East and East Midlands where house prices increased by over 7.2% and 7.1% respectively last month alone.”
The UK Property Transaction statistics also indicate that July saw a rise in the number of seasonally adjusted property transactions completed in the UK valued at £40,000 or over. Annually, the figure grew by 8.3% in comparison to the previous year.
The number of completed house sales can also be analysed by using the most recent statistics from Land Registry. Across both England and Wales, a change in house sales can be observed when looking at the number which took place in May 2017 and those which occurred during the corresponding period in 2016.
In England, completed house sales during May 2017 came to a total of 58,209 in comparison to 2016’s figure of 60,179. This represents a fall of 3.3%.
The total number of house sales in London dropped by 6.8% to 6,169. During May 2016, the figure reached 6,617.
The number of completed house sales in Wales during May 2017 came to a total of 3,406. This is 9% higher than 2016’s total of 3,125.
The full dataset can be accessed here.