Information shared by TwentyCi comparing the activity levels in the first five months of 2020 to the same period last year, has thrown up some interesting results.
Since the re-opening of the English property market on 13th May 2020, the latest weekly data seen by TwentyCi suggests that the market is now operating at 75% of the 2019 norms it would expect to see.
Overall, there was a slump in April as a result of the lockdown, this was inevitable. However, exchanges were still at 68% of the 2019 norms in April. Demonstrating that the property market wasn’t completely wiped out as a result of the pandemic.
Ian Lancaster, CEO of TwentyCi Group, said:
“As we enter June and our lockdown, restrictions across society and the economy continue to ease, our key indicators are showing the property market re-bounding at a significant rate and pace.
“Whilst New Instructions and Sales Agreed bore the considerable impact of the property market lockdown in April and May, Exchanges for the same period were 68% of 2019 volumes suggesting an underlying confidence in the property market. As such, with the majority of Estate Agents now back open we remain cautiously optimistic as to the resilience of the residential property market.”
Below, we take a look at the monthly comparisons for 2020 and 2019 respectively.
New Instructions

This graph clearly demonstrates the impact the pandemic has had on the property market. January and February respectively were following a similar trend to the previous year as properties continued to be placed on the market. However, once lockdown happened the number of new instructions began to fall.
Shockingly, in April new instruction figures for 2020 were at 14% of that of 2019. However, as the property market re-opened in May, new instructions have begun to climb as the industry ‘bounces back’.
Sales Agreed
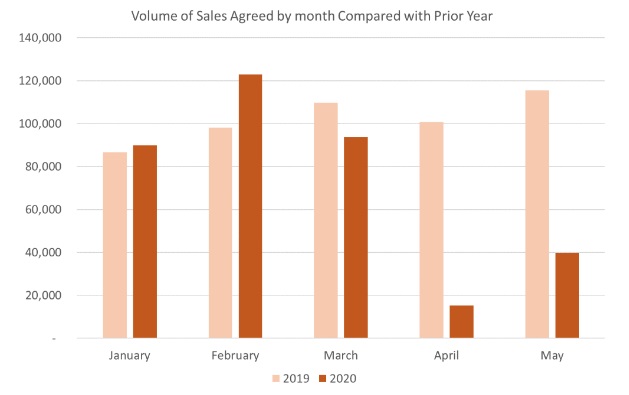
The “Boris Bounce” is said to be the reason behind January and February’s sales figures in 2020 surpassing that of the previous year.
But once again, the graph clearly shows the decline in sales as a result of lockdown. With only 15% of sales agreed in April 2020 in comparison to the 2019 figures.
Exchanges

It’s the trend that is being shown in this graph, which indicates to TwentyCi that there is confidence in the property market.
Whilst new instructions and new sales were temporarily placed on hold as a result of the lockdown. Those sales that were already in the pipeline continued to work through, resulting in a lower dip.
In April 2020, 68% of exchanges took place compared to the previous year, which is a lot higher than the 14% and 15% mentioned above in the new instructions and sales graphs.